
India’s Growth Numbers Were Wrong. By a Lot.
A March 2026 report from the Peterson Institute for International Economics says India overstated its own economic growth by up to 2 percentage points every year for over a decade. Here is exactly what that means.
ECONOMY
3/17/20264 min read
India’s Growth Numbers Were Wrong. By a Lot.
A March 2026 report from the Peterson Institute for International Economics says India overstated its own economic growth by up to 2 percentage points every year for over a decade. Here is exactly what that means.
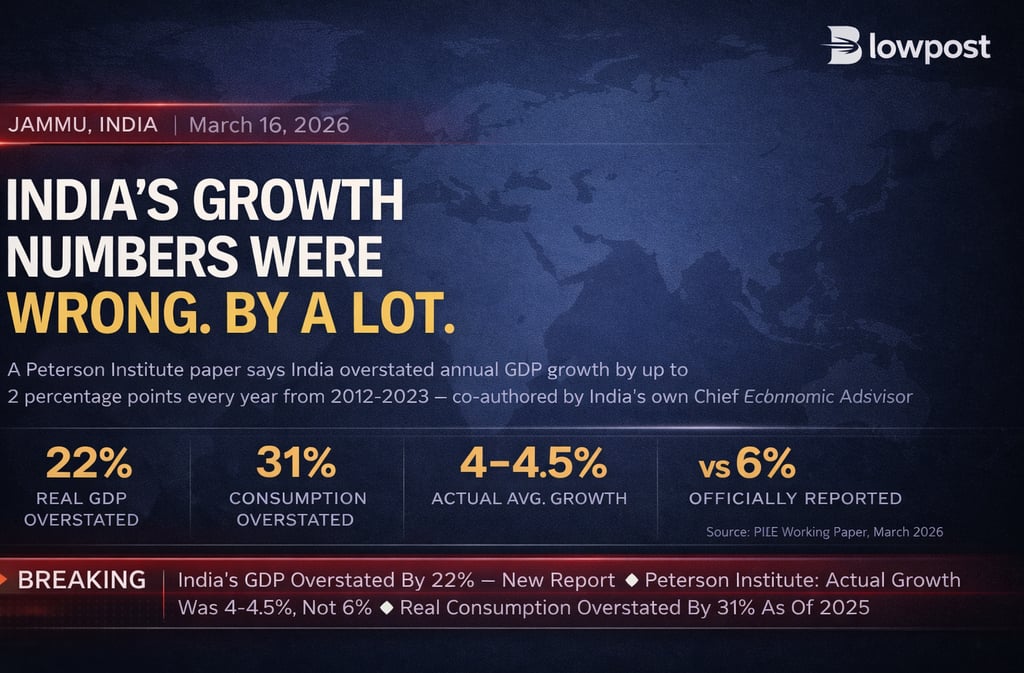
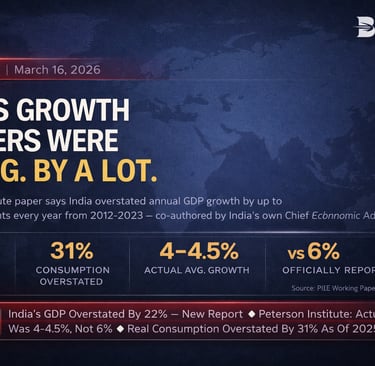
2%-Annual overestimation (2012–2023)
22%-Real GDP overstated as of 2025
31%-Real consumption overstated
4–4.5%-Actual avg. growth vs. reported 6%
What the Report Actually Says
The Peterson Institute for International Economics (PIIE) published a working paper in March 2026. It was written by three senior economists: Abhishek Anand, Josh Felman, and Arvind Subramanian. Subramanian is the former Chief Economic Advisor of India.
Their conclusion: India’s official GDP growth figures were wrong — consistently, and in one direction.
Between 2012 and 2023, India overstated annual growth by 1.5 to 2 percentage points. The officially reported average growth was 6%. The actual average, according to the paper, was 4 to 4.5%.
That gap compounds over a decade. By 2025, the paper estimates:
→ The level of real GDP is overstated by 22%
→ The level of real consumption is overstated by 31%
→ The average Indian’s actual standard of living is significantly lower than official data shows
IMPORTANT CONTEXT
This is not an accusation of deliberate fraud. The paper argues that India’s 2015 GDP methodology was structurally flawed — it missed the informal economy and used the wrong inflation tools.
What Happened Before 2012?
The paper does not just criticize the post-2012 numbers. It also says the pre-2012 numbers were wrong in the opposite direction.
Between 2005 and 2011, India’s growth was actually underestimated by 1 to 1.5 percentage points per year. The economy was growing faster than the data showed.
Key indicators confirm this: bank credit, exports, electricity consumption, and tax revenues all posted double-digit annual growth between 2005 and 2011.
After 2012, all those same indicators collapsed. But official GDP growth barely moved. That contradiction — strong real-world data before 2011, weak real-world data after 2012, but steady GDP numbers throughout — is what the paper is trying to explain.
Two Reasons the Numbers Were Wrong
Reason 1: The Informal Economy Was Invisible
India’s informal sector — small shops, street vendors, cash-based businesses — accounts for roughly half of national output and 90% of all employment.
The 2015 GDP methodology assumed the informal sector grew at the same rate as large, formal corporations. When both are thriving, this assumption works. When they diverge, it breaks.
Three events hit the informal economy hard after 2016:
→ Demonetization in November 2016 wiped out 86% of India’s currency overnight. Cash-based businesses collapsed.
→ The Goods and Services Tax (GST) rollout in 2017 added compliance costs that small businesses could not absorb.
→ COVID-19 in 2020 devastated informal workers and unregistered enterprises far more than large corporations.
Formal companies adapted. They had digital infrastructure, access to credit, and accountants. Small traders did not. GDP, anchored to formal sector proxies, saw the former and missed the latter.
Reason 2: The Wrong Inflation Tool
To calculate real growth, you strip out inflation from nominal numbers. The tool used for this is called a deflator.
India’s 2015 methodology used the Wholesale Price Index (WPI) as its deflator. WPI tracks costs of raw materials — particularly oil.
When global oil prices fell sharply after 2014, WPI inflation fell with them. This made it look like real output was growing faster than it actually was. Between 2011 and 2025, WPI inflation was on average 2.2 percentage points lower than consumer price inflation (CPI).
The result: lower-cost oil boosted corporate profit margins. The methodology counted this profit boost as real economic growth. It was not.
The Human Cost Hidden in These Numbers
Statistics are not just academic. When GDP is overstated, poverty and living standards are also misjudged.
Private consumption expenditure in the new GDP series is 10.9% lower than in the old series for 2025–26. That is not a rounding error. It means the average Indian household was consuming significantly less than the government’s data implied.
WHAT THIS MEANS
If the baseline standard of living was lower than reported, then progress on poverty reduction over the past decade may also be overstated. People who were reported to have crossed the poverty line may not have.
India’s World Inequality Report 2026 data also shows that 1% of Indians hold 40% of national income — one of the highest concentration rates in the world. A GDP number that overstates the size of the pie does not change how unequally it is divided. It just makes inequality harder to see.
What the Government Did in February 2026
On February 27, 2026, India’s Ministry of Statistics and Programme Implementation released a revised GDP series with a new base year of 2022–23.
The revisions directly address both problems the PIIE paper identified:
→ Better data on the informal sector: The new series uses Annual Survey of Unincorporated Enterprises, Labour Force Surveys, LLP filings, and more granular corporate disclosures.
→ Better deflation: Single deflation has been eliminated. Double deflation is now applied in manufacturing and agriculture, using more granular price indices.
The new methodology estimates real GDP growth of 7.6% in FY 2025–26. Strong numbers — which raises its own question. Has the overestimation actually been corrected, or has only the future methodology been cleaned up while the old historical record remains distorted?
The One Thing That Still Has Not Happened
A back series.
A back series means going back through the historical data — 2012, 2015, 2018, 2020 — and recalculating all those years using the new, better methodology. That would tell us officially what the actual growth rate was during those years.
MoSPI has said the back series will be released by December 2026. Until that happens, we have two numbers that cannot be compared: old GDP figures calculated under a flawed methodology, and new GDP figures calculated under a different one. There is no bridge between them.
THE HONEST ANSWER
We do not yet have a clean, officially revised picture of what India’s economy actually did between 2012 and 2023. That picture is due in December 2026.
The Bigger Picture
India spent over a decade describing itself as the world’s fastest-growing major economy. That claim rested on GDP numbers that this paper says were structurally inflated.
The informal sector — where most Indians actually work — was invisible to the methodology at precisely the moments when it was being hit hardest. Demonetization. GST shock. COVID. Each shock devastated small businesses and daily wage workers. The GDP number barely flinched.
That is the structural story underneath the statistics. The formal economy adapted and reported strong profits. The informal economy contracted and reported nothing — because it had no mechanism to report anything. And the methodology chose to use the former as a proxy for the latter.
What the PIIE paper has done is put a number on that gap between two Indias: the India that showed up in the data, and the India that did not.
-Blowpost-March 16th 2026.
Connect
contact@blowpost.com
© 2025. All rights reserved.
BlowPost is an independent geopolitical and market intelligence publication. We cater to traders, bankers, logistics professionals, and anyone who wants to understand the structural forces beneath global events — energy markets, capital flows, and trade corridors. No ideology. No institutional interest. Just the structure.